

Marketing reporting is where good work goes to die. The campaigns run, the data exists, and then someone spends the first Monday of every month copying numbers between tabs. The best marketing reporting tools solve one of two problems: they either move data automatically, or they present it in a way a client or a manager can read without a call.
This list is for in-house marketers who report to someone else, and for agencies reporting to several clients. It covers free dashboard builders, per-client agency platforms and the connector tools that feed everything else, so you can tell which layer of the stack you are actually missing.
Before you buy anything, decide which numbers belong in the report. A tool cannot make a bad metric useful, and our guide to the marketing metrics that matter is the cheaper starting point.
How we chose these tools
This round-up is based on each vendor’s own public documentation and pricing pages, checked on 8 September 2026. We have not run hands-on trials of these products, and nobody at PW Live tested them in a live account. Every figure below was read from the vendor’s own page on that date, with its billing basis attached; where a page would not display prices or a vendor sells only by quote, we say so rather than repeat a number from memory. Confirm current pricing before you buy. No vendor paid for inclusion.
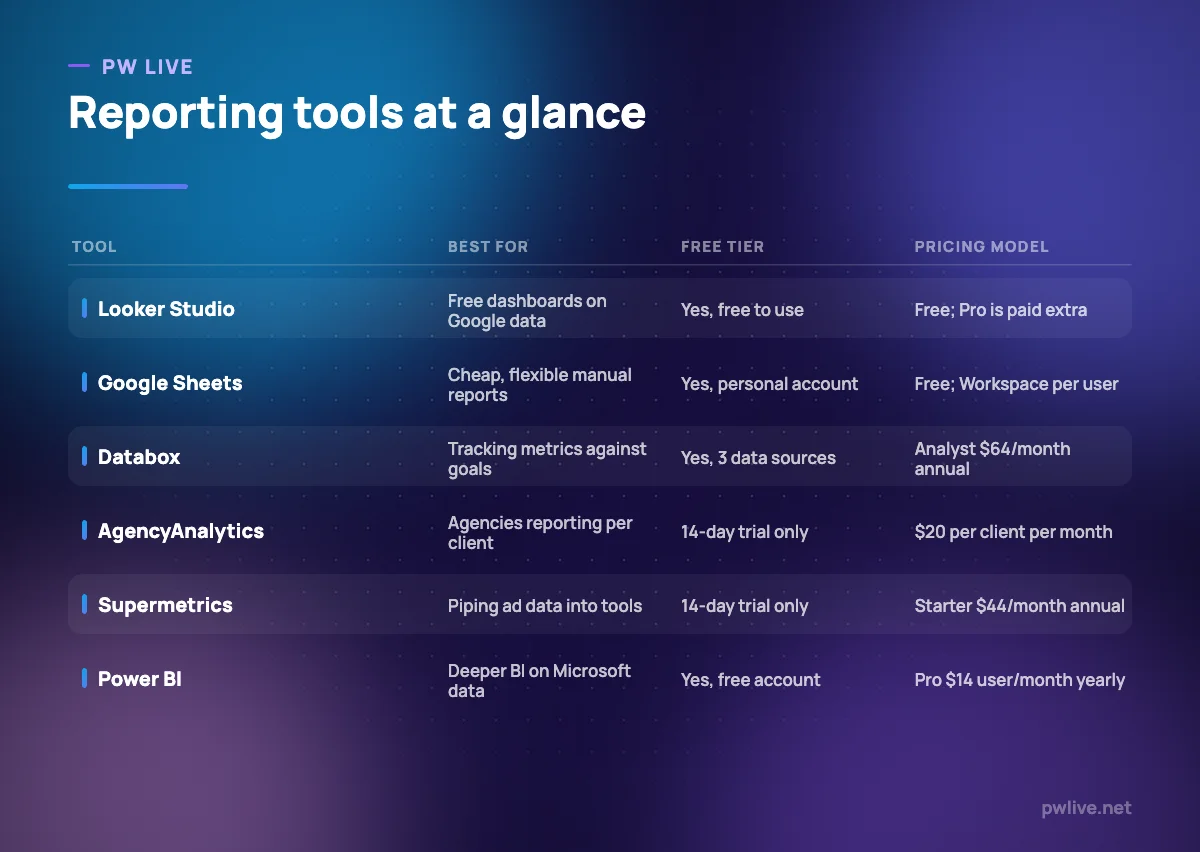
1. Looker Studio — best for free dashboards on Google data
Looker Studio is the default answer for anyone whose data already lives in Google Analytics, Google Ads, Search Console or Sheets. It is free, reports are shareable by link or embeddable, and several people can edit at once. Built-in and partner connectors cover a wide range of sources, though the partner ones are usually paid.
It is a genuine dashboard tool, not a toy, and plenty of agencies deliver client reporting on it. The cost is patience: complex reports get slow, and blending data from several sources takes real effort.
What it does well – Free, with sharing, embedding and real-time collaboration – Native connections to the Google marketing and analytics stack – Reports can be duplicated as templates across clients
Where it falls short – Non-Google sources usually need a paid connector such as Supermetrics – Large or blended reports become slow to load – Team workspaces, extra delivery schedules and data residency sit in the paid Pro tier
Pricing: Free to use. Looker Studio Pro is a paid upgrade with a 30-day trial; Google’s Pro documentation does not publish a rate. Looker Studio
2. Google Sheets — best for cheap, flexible reporting
Google Sheets still deserves a place on this list, because a well-built sheet beats a badly chosen dashboard. It is free with a personal Google account, it accepts exports from every platform on earth, and it can be shaped to a client’s exact question rather than a template’s idea of one.
It is also the fallback when a tool cannot do something. Most reporting stacks end up with at least one sheet in them, and knowing your way around pivot tables pays for itself; our guide to using spreadsheets well covers the basics.
What it does well – Free for personal use, and included in every Google Workspace plan – Total layout control and easy sharing or commenting – Works as the destination for connector tools like Supermetrics
Where it falls short – Manual updates unless you pay for a connector or write scripts – No alerting, and no proper version of a live dashboard – Business features such as admin controls require paid Workspace plans
Pricing: Free with a personal Google account. Workspace plans are priced per user per month, with a 16% saving on a one-year commitment; check the page for current per-user rates. Google Workspace pricing
3. Databox — best for tracking metrics against goals
Databox is built around metrics and targets rather than pretty reports. You connect sources, pick the metrics that matter, set goals, and get a dashboard plus alerts when something moves. The free plan is real — three data sources, one dashboard, one user — which makes it easy to test on your own numbers.
The team plans include unlimited users, which is unusual and useful when you want the whole company looking at the same figures. Data sources are the metered resource instead.
What it does well – Free plan with 3 data sources, 1 dashboard and 10 custom metrics – Goal tracking and alerting, not just visualisation – Unlimited users on Pro and Growth plans
Where it falls short – Team plans include only 3 data sources, then $5.60 per month each – The step from Analyst at $64 to Pro at $159 per month is steep – Prices shown are annual; monthly billing costs 20% more
Pricing: Free tier; Analyst $64 per month, Pro $159 per month, Growth $399 per month, all billed annually; Custom is quote-based. Databox pricing
4. AgencyAnalytics — best for agencies reporting per client
AgencyAnalytics prices the way agencies actually work: per client, not per seat. One Core plan covers unlimited staff and client users, with white-labelled reports and dashboards, so adding a junior or giving a client a login costs nothing extra.
That model is the reason to choose it. If you report on twenty clients with a team of six, per-seat tools get expensive fast and this does not. If you have one business to report on, it is the wrong shape.
What it does well – $20 per client per month billed annually, with unlimited users – White-labelled client reports and dashboards – 14-day free trial with no card, plus a 30-day money-back guarantee
Where it falls short – Poor value for a single in-house team with one account to report on – Rank tracking and AI tracking are paid add-ons, not included – Annual plans require a one-year commitment
Pricing: $20 USD per client per month billed annually; Rank Tracker $41.67 per month per 500 keywords and AI Tracker $20.83 per month per 250 credits; custom pricing above 25 clients. AgencyAnalytics pricing
5. Whatagraph — best for high-volume reporting teams
Whatagraph sits at the top of this list on price and is aimed at teams whose reporting volume has outgrown a person. Its Max plan starts from 50 credits, where one credit is one connected data account, and includes unlimited users and reports.
That pricing tells you who it is for. At EUR 699 per month it is a commitment for a small agency, and a rounding error for a large one that currently pays two analysts to assemble decks.
What it does well – Unlimited users and reports on both published plans – Credit-based model scales on connected accounts, not headcount – Prime tier adds priority support and tailored onboarding
Where it falls short – Max is listed at EUR 699 per month billed annually, with no cheaper published tier – Prime pricing is quote-based – No free tier to test on your own data
Pricing: Max from EUR 699 per month billed annually, from 50 credits; Prime is quote-based. Whatagraph pricing
6. Supermetrics — best for pulling ad data into your own tools
Supermetrics is not a dashboard. It is the pipe: it pulls data from advertising, social and analytics platforms into Google Sheets, Looker Studio, Excel, Power BI or a data warehouse, on a schedule. If your reporting layer is fine but the copying is not, this is the missing piece.
Pricing is by destination, data sources and users rather than data volume, and the vendor states there are no data volume fees. Note that the entry tier refreshes weekly, which is not enough for anyone managing daily ad spend.
What it does well – Feeds Sheets, Looker Studio, Excel, Power BI and warehouses alike – Pricing does not vary by destination, and there are no data volume fees – 14-day free trial without a card
Where it falls short – Starter is limited to 3 data sources, 1 user and weekly refreshes – Growth at $177 per month billed yearly still allows only 6 data sources and 2 users – Extra users, destinations and sources are all chargeable add-ons
Pricing: Starter $44 per month billed yearly or $55 monthly; Growth $177 per month billed yearly or $222 monthly; Enterprise quote-based. Supermetrics pricing
7. Microsoft Power BI — best for deeper analysis on a Microsoft stack
Power BI is the option when marketing reporting has to meet finance and operations data. It handles larger models than a dashboard tool, has a proper modelling language, and fits organisations already running Microsoft 365. You can build reports on a free account; sharing them with colleagues is what needs a licence.
It is more BI tool than marketing tool, so expect to spend time on data modelling rather than picking widgets. That is a fair trade if the questions you get asked span more than marketing.
What it does well – Free account for building reports before anyone pays – Handles bigger, joined-up datasets than marketing dashboards – Per-user licensing at $14.00 a month is cheap next to agency platforms
Where it falls short – Sharing and collaboration require a Pro licence per person – Marketing connectors often mean a paid tool such as Supermetrics – The learning curve is real: this is data modelling, not drag and drop
Pricing: Free account; Power BI Pro $14.00 per user per month paid yearly; Premium Per User $24.00 per user per month paid yearly; Fabric capacity priced separately. Power BI pricing
How to choose between them
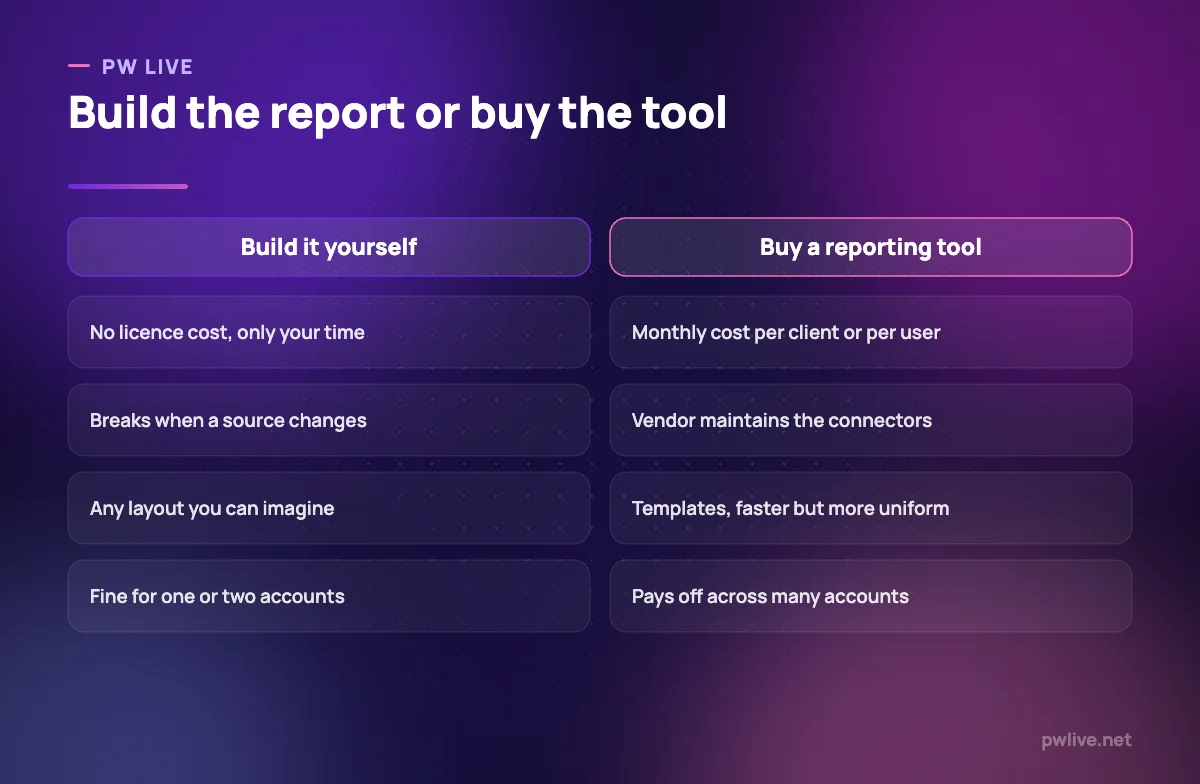
Count the accounts you report on. One business, one report: build it in Looker Studio or Sheets and spend nothing. Several clients: a per-client platform like AgencyAnalytics almost always beats assembling the same report by hand, and the maths gets better with every client you add.
Then ask where the data has to come from. If everything is Google, Looker Studio alone is enough. The moment Meta, LinkedIn, TikTok or an email platform enters the picture, you need either a connector such as Supermetrics or a platform with those integrations included, and that connector cost belongs in your comparison.
Finally, match the tool to who reads the report. Clients want a clear, branded page. Managers want targets and alerts, which is Databox’s strength. Analysts want a model they can query, which is where Power BI earns its licence. If you are reporting on paid campaigns, our guide to running your first paid ad campaign sets out which numbers to lead with, and the data science and AI skill track goes deeper on analysis. There is more in our apps and tools coverage and in digital marketing fundamentals.
Key takeaways
- Looker Studio plus Sheets covers most single-business reporting at no cost
- Per-client pricing suits agencies; per-user pricing suits in-house teams
- Connector costs are part of the total: budget them alongside the dashboard
- Databox is the pick when goals and alerts matter more than layout
- Whatagraph’s entry price puts it out of reach for small agencies
- Power BI is worth it when reporting extends beyond marketing data
Frequently asked questions
Do I need a paid reporting tool at all?
Not if you report on one business from mostly Google sources. Looker Studio is free and does that well. Paid tools earn their place when you repeat the same report for many clients, or when pulling the data by hand costs more hours than the licence.
What is the difference between a dashboard tool and a connector?
A dashboard tool displays data; a connector moves it. Looker Studio, Databox and Power BI display. Supermetrics moves data into them on a schedule. Agency platforms bundle both, which is why their per-client price looks higher.
How often should marketing reports go out?
Monthly for clients and management, with a live dashboard anyone can open in between. Weekly reporting on channels with small daily volumes mostly measures noise, and it consumes time you could spend on the campaigns.
Can these tools replace analytics tools?
No. They read from your analytics and advertising platforms and present the result. You still need the underlying measurement set up correctly, and a reporting tool will happily present a badly configured conversion as fact.
Pricing checked 2026-09-08. 6 of 7 prices in this article were read from the vendor’s own pricing page on that date; the rest publish no figure, so we describe the model instead. Vendors change prices without notice, so open the linked page before you commit.
Keep learning with PW Live
Browse every tool comparison, or follow the Digital Marketing track to learn the skills these tools support.





Leave a Reply